
The Returns Analytics & Insights Dashboard gives you a complete overview of your return performance — helping you track resolutions, identify return patterns, and make informed business decisions.
Where to Find It
Log in to your LateShipment.com dashboard.
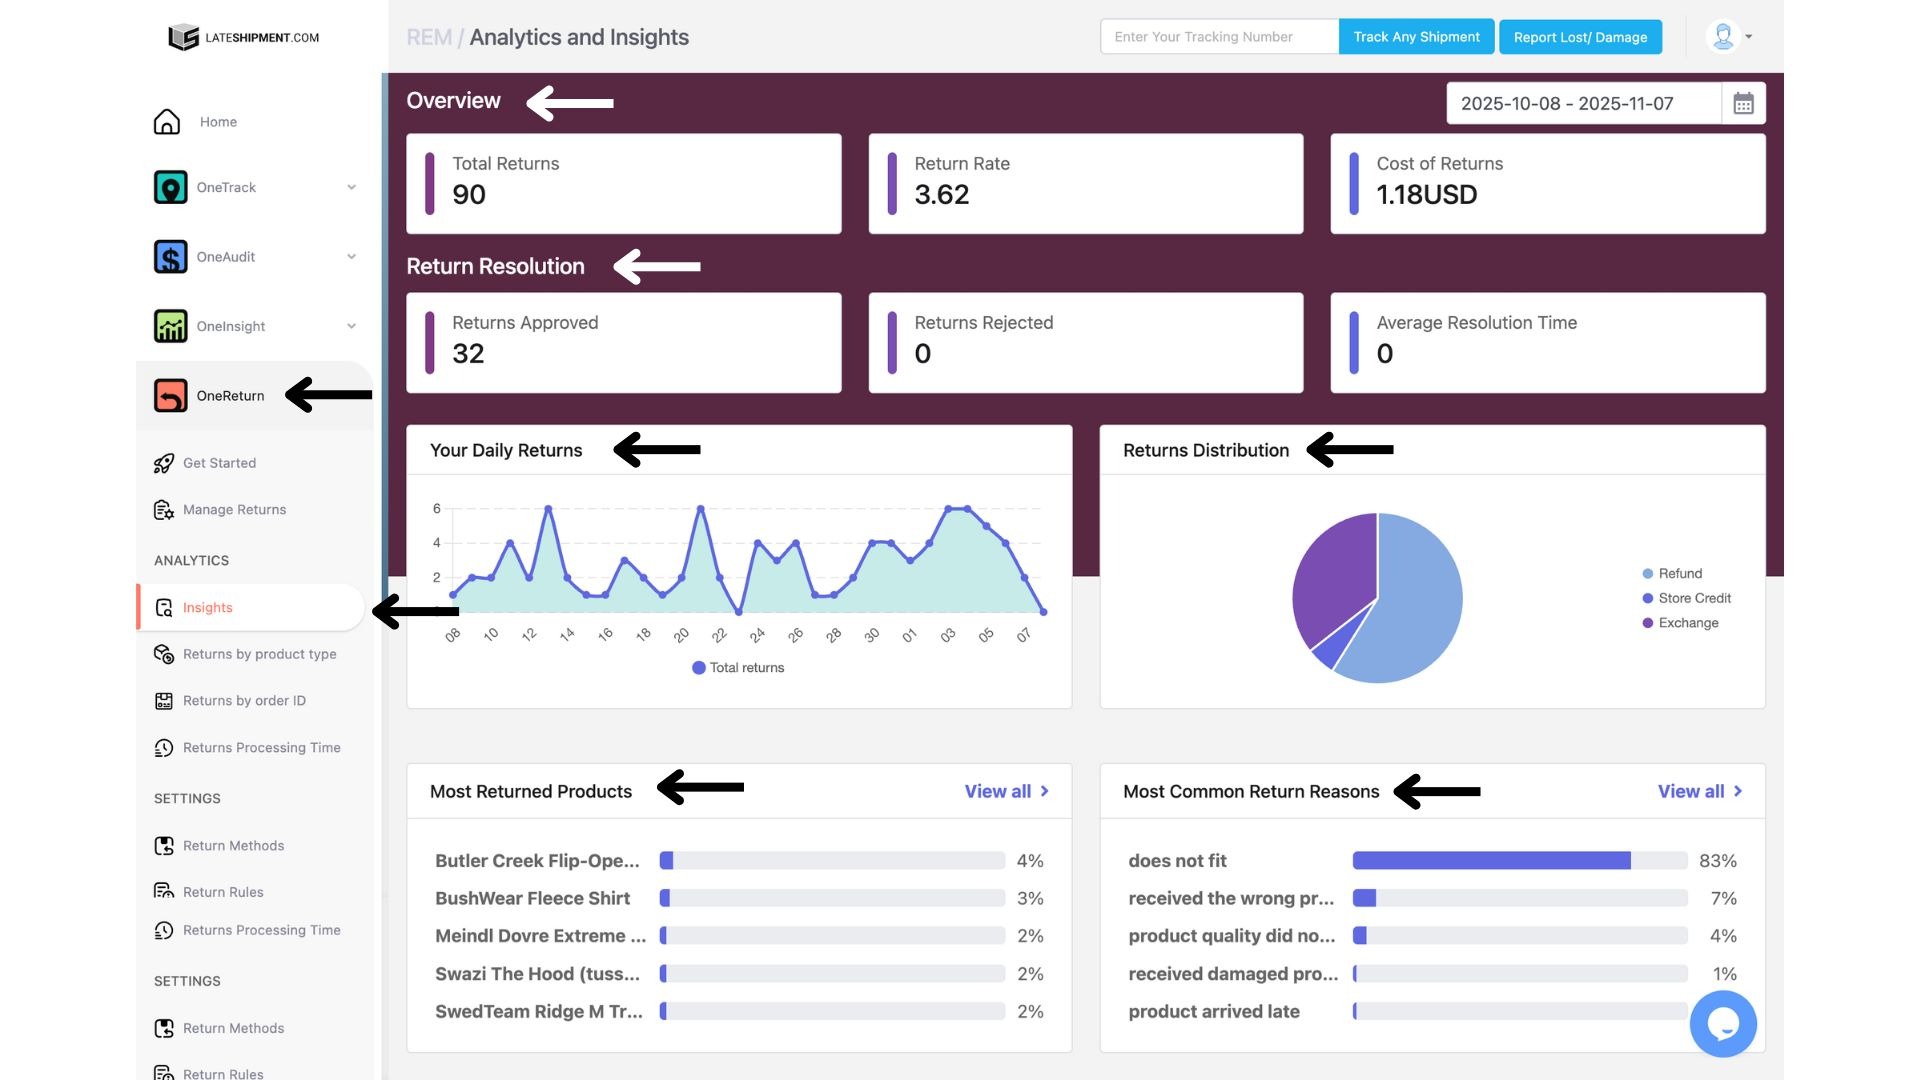
From the left-hand menu, click One Return.
Select Analytics & Insights under the Analytics section.
What You’ll See on the Dashboard
The dashboard provides a clear summary of your returns activity, including:
Return Overview – A quick snapshot of your total returns and resolution outcomes.
Return Resolutions – Shows how many returns were approved or rejected, along with the average time taken for each resolution.
Returns Distribution – Displays how your returns are split by type:
Refunds
Exchanges
Store Credits
Most Returned Products – Identifies which products are returned most often, helping you pinpoint potential product or fulfillment issues.
Most Common Return Reasons – Highlights why customers are returning items, allowing you to take proactive steps to reduce future returns.
Filtering by Date
To focus on returns from a specific time period:
Use the Date Filter at the top-right corner of the dashboard.
Choose your desired date range.
Click Apply to view data for that period.
Why It’s Useful
The Returns Analytics & Insights Dashboard helps you:
Evaluate how efficiently returns are being processed.
Identify trends and recurring return reasons.
Improve customer satisfaction by addressing problem areas.
That’s It!
You can now use the Returns Analytics & Insights Dashboard to get a detailed view of your returns, resolutions, and performance — all in one place.
Was this article helpful?
That’s Great!
Thank you for your feedback
Sorry! We couldn't be helpful
Thank you for your feedback
Feedback sent
We appreciate your effort and will try to fix the article